Statistical technical sports analysis

  • État: Closed
  • Prix: $151
  • Propositions reçues: 17
  • Gagnant: Collie33

Résumé du concours

Hi Guys,

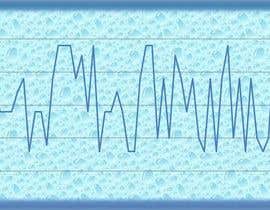
I am trying to develop a technical analysis system involving a graphical display format, which includes such analytical tool variables such as a trend-line, support and resistance lines etc. The sample of data I have given, is related to sporting odd values.

Firstly the prime purpose of this task, is to help me identify the trend-line in a sports betting graph, as the odds go up and down, if a graphical technical analysis could be developed in such a way, that it would be possible to plot a line from one peak to another as a simple and fast method of prediction of whether or not the individual trusts this specific bet. This trend-line should be able to allow me to predict forthcoming odds movements, even before the sporting event result is decided.

Please see latest sample attached which shows those bets that were successful (column A) and the relevant odds which were between 1.8 and 2.2 (column B). There are 761 bets with 368 of them winning. That's an average strike rate of 48% with an average price of 2.00.

In addition the technical analysis, would be developed in a way, that allows a phase called ‘consolidation’ to be identified. In this particular phase, the technical analysis system should allow parallel lines to be created, in which it moves sideways without any sign of a climb or descent, allowing me to identify when the market is getting prepared for the next trend. Therefore helping to identify other variables that I would also like to be included in the technical analysis system i.e. support and resistance levels.

I am willing to pay a bonus for a proven formula. I will gauge your formula myself by applying your analysis onto other data that I hold.

If I feel I can establish a good working relationship with somebody I'd be keen to provide further snippets of data that would need cross referenced with the initial set to help indicate stronger betting signals. Again, a bonus may be available if the cross referencing of multiple data subsets are proving to provide stronger signals and these hold firm when I apply to other data not supplied to you.

Compétences recommandées

Tableau de clarification publique

  • tariksamir
    tariksamir
    • il y a 10 ans

    what about my logo 25 26 you will like them

    • il y a 10 ans
  • jamestiff13
    Titulaire du concours
    • il y a 10 ans

    Come on people, this contest is wide open - I have no definite winner yet!! Show me some of your stats talent.

    • il y a 10 ans
  • jamestiff13
    Titulaire du concours
    • il y a 10 ans

    Hi Collie, your link is broken, if you can private message me. That would be great

    • il y a 10 ans
  • sajan0100
    sajan0100
    • il y a 10 ans

    Sir,select us as a winner.we will work for u until u are satisfied.

    • il y a 10 ans
    1. jamestiff13
      Titulaire du concours
      • il y a 10 ans

      Show me some sample of the work that you can do, and I may consider you.

      • il y a 10 ans
  • jamestiff13
    Titulaire du concours
    • il y a 10 ans

    The values actually relate to sports odds and I want the ability to easily perform data manipulation. Some of these requirements would be to delete all rows where the values fall outside a specific range (e.g. between 2.50 to 3.00) and have the remaining rows plotted on a graph with the usual support and resistance lines, moving averages, etc.

    I already know the statistical percentage of winning bets but want this to be configurable. So if I said that 50% of bets are successful you could further improve my chances of winning by devising some further indicators on the graph to tell me when to place a bet. Please take the bet price into consideration if you feel that this should be used to determine a variable staking plan.

    • il y a 10 ans
    1. jamestiff13
      Titulaire du concours
      • il y a 10 ans

      sample attached which shows those greyhound bets that were successful (column A) and the relevant odds which were between 1.8 and 2.2 (column B). There are 761 bets with 368 of them winning. That's an average strike rate of 48% with an average price of 2.00.

      • il y a 10 ans
    2. jamestiff13
      Titulaire du concours
      • il y a 10 ans

      I am trying to work out the 33%, if could devise a systematic formula..that would be great. I have data that I can give you, but I just want you to work with this.

      • il y a 10 ans
  • jamestiff13
    Titulaire du concours
    • il y a 10 ans

    Hi guys, as we only have three and half days left, I was just wondering, has anyway got some new material for me? Many thanks

    • il y a 10 ans
    1. cnikolaou
      cnikolaou
      • il y a 10 ans

      Hi, I just came across this one last night. I am a bit puzzled with what your description where you mention 761 bets. The file you provide however has thousands of entries. Am I missing smth?

      • il y a 10 ans
    2. jamestiff13
      Titulaire du concours
      • il y a 10 ans

      See messages relating to scenario1, 2 and 3.

      • il y a 10 ans
  • jamestiff13
    Titulaire du concours
    • il y a 10 ans

    Scenario 1:
    The odds available on sporting events more often than not are an accurate reflection of the chances of winning for that individual/team.
    This holds true over a long period of time but when a short period of time is looked upon it may not be the case.
    To explain the above scenario take a look at http://www.math.louisville.edu/~pksaho01/teaching/chapter16.pdf.  Based on the law of averages I’m looking to swing the odds of an event in my favour based on a series of similar events which have already occurred.  In other words, if I’ve tossed 1000 coins and 600 have landed on heads then I’d expect to place bets on the side of tails landing more often than not with future tosses in the immediate short period of time.
    Can you implement something that would suggest to me when to bet on heads, when to bet on tails and when not to bet?
    In addition to the above main scenario, there are two other scenarios I’d like to apply to the above to improve my chances.

    • il y a 10 ans
    1. psdttg
      psdttg
      • il y a 10 ans

      Nobody is going to be able to help you with this, since the past history of coin tosses tells you *nothing* about future coin tosses. There's even a name for the mistake belief that they do - it's called the "Gambler's Fallacy" http://en.wikipedia.org/wiki/Gambler%27s_fallacy
      Essentially, the coin has no memory of it's past history. You could have flipped 999 heads in a row, and the probability of the next flip being heads or tails is still 50-50.

      • il y a 10 ans
    2. psdttg
      psdttg
      • il y a 10 ans

      *its past history

      • il y a 10 ans
  • jamestiff13
    Titulaire du concours
    • il y a 10 ans

    You have the opt of contacting me on jamestiff30 hotmail com. If need be....cheers

    • il y a 10 ans
  • Minutieux
    Minutieux
    • il y a 10 ans

    Hi, I am an MBA with expert skills in excel and statistics. My work with NGOs mainly revolves around statistics. However, in order for me to help you i would need some clarifications as to what you really need. Here is a statistics application i've done for the Euromillions lottery. Please visit this link: https://sites.google.com/site/euromillionstatistics/statistics

    • il y a 10 ans
    1. jamestiff13
      Titulaire du concours
      • il y a 10 ans

      Hi Minutieux, I will study your work tomorrow evening. My project is based on sport probability. So if you could possibility apply your statistical application knowledge to that specific subject, that would be great. As you seem to be very knowledgable in the mathematical/stats field. Thanks

      • il y a 10 ans
  • jamestiff13
    Titulaire du concours
    • il y a 10 ans

    Hi everyone, just a reminder to keep it going, as no one has really stood out for me yet. Some of you's have made more of an effort than others. If you need guidance, just ask me. If someone does start giving me really good work, there will definitely be a bonus reward at the end, a highly recommended freelancer feedback review given and the promise of more work in the future. Thanks

    • il y a 10 ans
  • jamestiff13
    Titulaire du concours
    • il y a 10 ans

    Scenario 3:
    In an ideal world it would be fine if the odds of an event were 50/50 (evens or 2.0 in decimal notation).  But with sporting events this would limit the number of selections if we were to only bet on outcomes that contained those odds.
    Can you apply something to the above scenarios that would take odds into consideration?  The original sample provided includes odds of a particular event over a number of years but when limited to odds of between 1.8 and 2.2 there are 3078 odds.  The average odds of all odds was about 2.01 and 48% of those bets won.  In my opinion this is not far off the mark for the odds representing a true reflection.
    Something that may be of use is let’s say the odds of heads landing in the next coin toss over the long term are 1.8 then betting on an outcome at odds of 2.0 would represent value and should provide me with an edge.

    • il y a 10 ans
  • jamestiff13
    Titulaire du concours
    • il y a 10 ans

    Scenario 2:
    Let’s assume there are 5 people tossing 1000 coins each as follows: person 1 tosses his first coin, person 2 tosses his first coin, person 3 tosses his first coin, and so on until all people have thrown their first coin where the process repeats again with each person throwing their second coin, the repeating the process again and again.  After a total of 30 tosses each person would have tossed 6 coins each.  If we were tracking the progress of each person individually as in scenario 1 we should hopefully come to a point where we would start betting on their next toss.  However, if we were to also combine everyone’s tosses into a separate trend (eventually totalling 5000 tosses) could we use the individual trends in conjunction with the overall combined trend to indicate a stronger signal?

    • il y a 10 ans

Montrer plus de commentaires

Comment commencez des concours

  • Publiez votre concours

    Publiez votre concours Rapide et facile

  • Obtenez des tonnes de propositions

    Obtenez des tonnes de propositions De partout dans le monde

  • Attribuez la meilleure proposition

    Attribuez la meilleure proposition Télécharger les fichiers - Facile !

Publier un concours maintenant ou rejoignez-nous maintenant !