Stock market change graphs (Candel-Stick)
par mikeitexpert
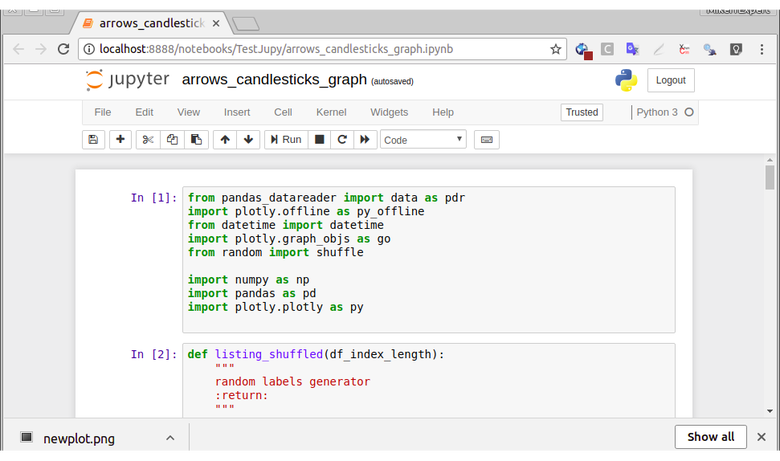
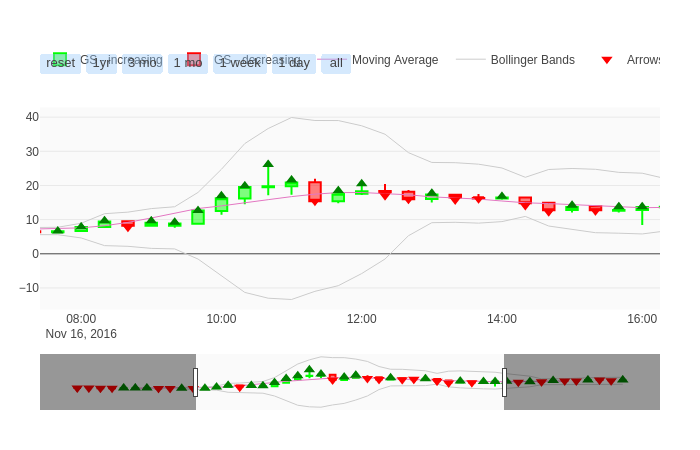
This project was partly develop by a previous developer on Jupyter notebooks. The requirement was to modify regular candlestick graph and apply Pandas re-sampling techniques to visualize the the change in a better way using change arrows. I utilized numpy and pandas to complete the task.

Me concernant
Software Engineer with thorough hands-on experience in levels of Software Development Life-Cycle including database design & development, front-end development using latest web-technologies, and familiar with different automated testing methods.