Excel Dashboard Redesign

  • État: Closed
  • Prix: $30
  • Propositions reçues: 1
  • Gagnant: Overseashelp

Résumé du concours

BACKGROUND:

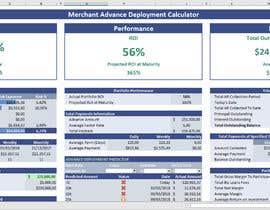
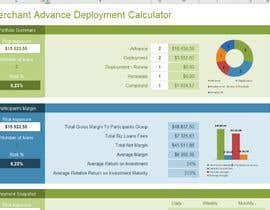
I have an Investment Portfolio Dashboard which is meant to display the following information to investors:

1. Health of the portfolio
2. Risk of the Portfolio
3. Performance of the Portfolio

The respective business is a loan / advance issuing company.

SOLUTION:

The current layout has been attached in a dummy spreadsheet. The issues that we have and which need to be addressed are:

1. Layout is not optimal
2. Individual elements not grouped logically
3. There is no flow in how the items are organised
4. Its very busy and difficult to read at a glance

WHAT WILL THE BEST ENTRY LOOK LIKE:

The winning entry will effectively demonstrate:
- Innovation
- Creativity
- Simplicity
- Clarity

The tool will be used by investors and potential investors so it is vital that it looks good and clearly communicates what we need it to.

Please design the solution in Excel, as the model is fed by calculations and needs to accept dynamic content. The excel dashboard must be presentation ready.

Compétences recommandées

Commentaire de l'employeur

“Very proactive freelancer, great energy and very creative. Went the extra mile to satisfy and add value, highly recommended!”

Image de profil WesleyJeftha, Australia.

Meilleures propositions de ce concours

Afficher plus de propositions

Tableau de clarification publique

  • pposhiya3669
    pposhiya3669
    • il y a 6 ans

    You need design with JPG format or Excel file?

    • il y a 6 ans
    1. WesleyJeftha
      Titulaire du concours
      • il y a 6 ans

      Design in Excel please...

      • il y a 6 ans
  • labibshah
    labibshah
    • il y a 6 ans

    Graphs and charts are the visual elements; what kind of else visuals are required to you?

    • il y a 6 ans
    1. WesleyJeftha
      Titulaire du concours
      • il y a 6 ans

      All I need is a design that fixes the layout and readability of the sample provided

      • il y a 6 ans
  • AUNKHAN12
    AUNKHAN12
    • il y a 6 ans

    The best representation of dashboard is tables with graphic charts, its better clear and easily understanding. I need more detail and the sporting files for this dashboard, please visit my profile first....

    • il y a 6 ans
    1. WesleyJeftha
      Titulaire du concours
      • il y a 6 ans

      Hi there, we have charts in other parts of the spreadsheet that the client is totally satisfied with, we just need to cleanup the presentation of the numbers on the dashboard

      • il y a 6 ans
  • tushars92
    tushars92
    • il y a 6 ans

    I can develop this dashboard with more analytic term. Therefore, I need more details. Kindly contact me.

    • il y a 6 ans
    1. WesleyJeftha
      Titulaire du concours
      • il y a 6 ans

      Hi there Tushar, thanks for responding, I dont need any work done on the logic / analytical layer, this project is simply about making the dashboard look nice and easy to read

      • il y a 6 ans
  • Godskid
    Godskid
    • il y a 6 ans

    Hi. Would you also like the functions (calculation) inserted in the necessary cells?

    • il y a 6 ans
    1. WesleyJeftha
      Titulaire du concours
      • il y a 6 ans

      Hi there, the calculations are working perfectly, its literally just the presentation and visual representation of the data

      • il y a 6 ans

Montrer plus de commentaires

Comment commencez des concours

  • Publiez votre concours

    Publiez votre concours Rapide et facile

  • Obtenez des tonnes de propositions

    Obtenez des tonnes de propositions De partout dans le monde

  • Attribuez la meilleure proposition

    Attribuez la meilleure proposition Télécharger les fichiers - Facile !

Publier un concours maintenant ou rejoignez-nous maintenant !